Relative Gene Expression Analysis Using the Comparative ΔΔCt (2⁻ΔΔCt) Method
Relative Gene Expression Analysis Using the Comparative ΔΔCt (2⁻ΔΔCt) Method
This technical post demonstrates the analysis and interpretation of relative gene expression data obtained using quantitative real-time PCR (RT-qPCR). The aim of this exercise is to practice the Comparative ΔΔCt (2⁻ΔΔCt) method, one of the most widely used approaches for relative gene expression analysis.
Using the class dataset, this report presents the step-by-step calculation of Ct, ΔCt, ΔΔCt, and relative fold change (2^-ΔΔCt), together with the biological interpretation of the resulting expression profile.
Mathematical Workflow of the Comparative ΔΔCt Method
The comparative ΔΔCt method (Livak & Schmittgen, 2001) is one of the most widely used approaches for relative gene expression analysis. It compares the expression of a target gene between experimental conditions while normalizing the data to a stable reference (housekeeping) gene. This normalization minimizes technical variation resulting from differences in RNA quantity, cDNA synthesis efficiency, and sample handling.
Before applying this method, two assumptions must be met:
- The reference gene should be stably expressed across all samples.
- The amplification efficiencies of the target and reference genes should be approximately equal.
Step 1 – Ct (Cycle Threshold)
The Ct value represents the PCR cycle at which the fluorescence signal first exceeds the background threshold. Because amplification is exponential, the Ct value is inversely proportional to the initial amount of target nucleic acid in the sample.
- Lower Ct → Higher initial gene expression.
- Higher Ct → Lower initial gene expression.
Step 2 – ΔCt (Delta Ct)
To normalize gene expression within each sample, the Ct value of the reference (housekeeping) gene is subtracted from the Ct value of the target gene.
\[\Delta Ct = Ct_{Target} - Ct_{Reference}\]This normalization compensates for differences in RNA quantity, cDNA synthesis, and other technical variations between samples.
Step 3 – ΔΔCt (Delta Delta Ct)
The normalized expression of each experimental sample is then compared with the normalized expression of the control group.
\[\Delta\Delta Ct = \Delta Ct_{Experimental} - Mean(\Delta Ct_{Control})\]Using the control group as the calibrator sets its average ΔΔCt value to zero, establishing the baseline expression level for all subsequent comparisons.
Step 4 – Relative Gene Expression (Fold Change)
Finally, relative gene expression is calculated using:
\[Fold\ Change = 2^{-\Delta\Delta Ct}\]This transformation converts the logarithmic Ct differences into linear fold-change values.
- Fold Change > 1 → Upregulation
- Fold Change < 1 → Downregulation
- Fold Change ≈ 1 → No significant change
Demonstration of the Comparative ΔΔCt Calculation
The calculation table was prepared using the class dataset provided during the qPCR exercise. The dataset included Ct values for the DMSO control group and the inhibitor-treated group, together with Tubulin as the reference housekeeping gene.
The calculations followed the workflow described above. First, the Ct value of Tubulin was subtracted from each target gene to calculate ΔCt for both the control and treated samples. Next, the ΔCt value of the control sample was used as the calibrator and subtracted from the treated ΔCt value to calculate ΔΔCt. Finally, the relative expression level of each gene was calculated using the 2⁻ΔΔCt equation.
The resulting table summarizes the complete calculation process.
| Gene Name | DMSO Control Ct | Inhibitor Treatment Ct | Control ΔCt | Treated ΔCt | Calibration ΔΔCt | Fold Change (2^-ΔΔCt) |
|---|---|---|---|---|---|---|
| Tubulin (Ref) | 23.30 | 23.30 | 0.00 | 0.00 | 0.00 | 1.00 |
| ascs | 29.09 | 28.51 | 5.80 | 5.21 | -0.59 | 1.50 |
| Delta | 25.96 | 25.54 | 2.67 | 2.24 | -0.43 | 1.34 |
| ets | 24.72 | 24.44 | 1.42 | 1.14 | -0.28 | 1.21 |
| foxA | 24.37 | 23.72 | 1.07 | 0.43 | -0.64 | 1.56 |
| gcm | 28.35 | 28.18 | 5.06 | 4.88 | -0.18 | 1.13 |
| NGN | 28.35 | 27.35 | 5.06 | 4.06 | -1.00 | 2.00 |
| opt | 31.02 | 31.71 | 7.72 | 8.41 | 0.69 | 0.62 |
| pak3 | 25.41 | 25.29 | 2.11 | 2.00 | -0.11 | 1.08 |
| pak4 | 25.57 | 25.25 | 2.28 | 1.96 | -0.32 | 1.25 |
| pitx | 29.68 | 31.72 | 6.38 | 8.43 | 2.05 | 0.24 |
| SM30 | 20.97 | 21.77 | -2.33 | -1.53 | 0.80 | 0.58 |
| sm50 | 23.70 | 24.81 | 0.40 | 1.52 | 1.11 | 0.46 |
| soxC | 25.07 | 24.33 | 1.78 | 1.03 | -0.74 | 1.68 |
| synB | 24.13 | 24.06 | 0.83 | 0.76 | -0.07 | 1.05 |
Table 1. Worked example of the comparative ΔΔCt calculations using the class qPCR dataset.
Relative Gene Expression Profile
The calculated fold-change values were visualized using a column chart to compare the relative expression of each target gene following inhibitor treatment. A horizontal baseline at a fold-change value of 1 represents the normalized expression level of the control group, allowing genes with increased or decreased expression to be readily identified.
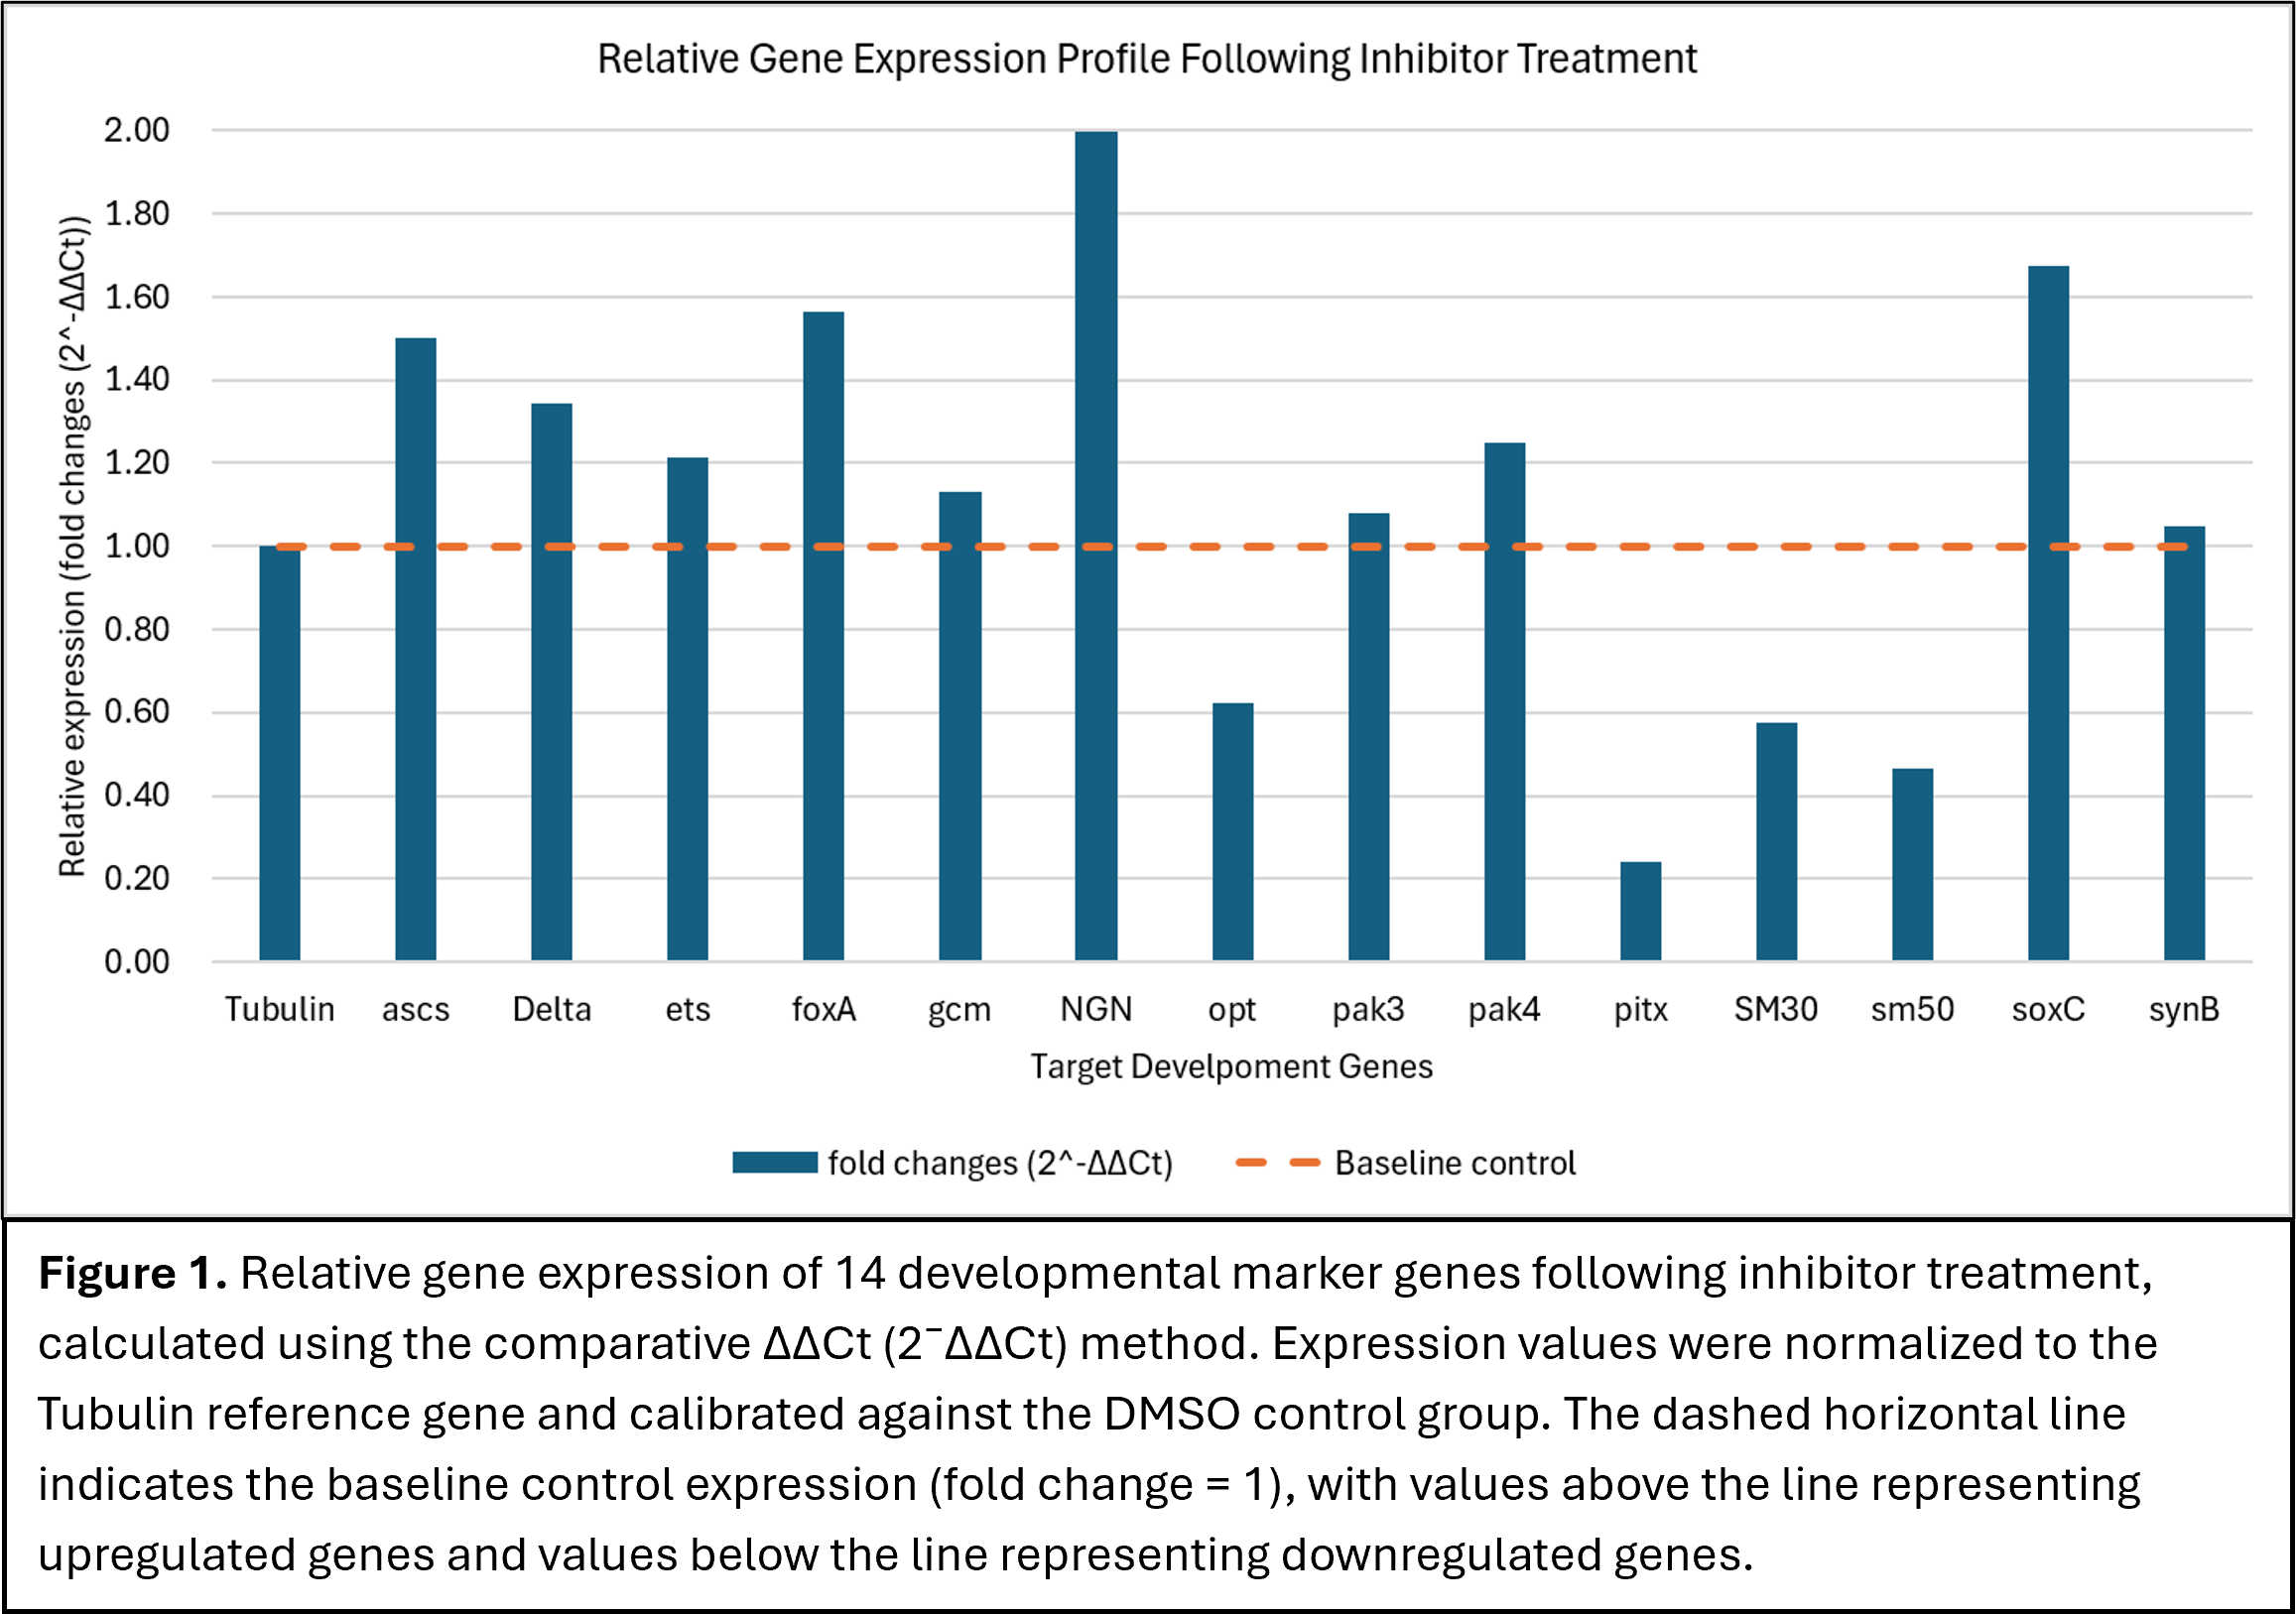
Figure 1. Relative gene expression of 14 developmental marker genes following inhibitor treatment, calculated using the comparative ΔΔCt (2⁻ΔΔCt) method. Expression values were normalized to the Tubulin reference gene and calibrated against the DMSO control group. The dashed horizontal line indicates the baseline control expression (Fold Change = 1).
Interpretation of Relative Gene Expression
The relative expression values obtained using the comparative ΔΔCt method can be interpreted according to their relationship to the control baseline (Fold Change = 1).
Upregulated Genes (Fold Change > 1)
Genes with fold-change values greater than 1 exhibit increased expression in the treated samples relative to the control group. In this dataset, NGN showed the highest level of induction (2.00-fold), followed by soxC (1.68-fold) and foxA (1.56-fold), indicating that inhibitor treatment increased the expression of these genes.
Downregulated Genes (Fold Change < 1)
Genes with fold-change values below 1 are expressed at lower levels in the treated samples than in the control group. The strongest reduction was observed for pitx (0.24-fold), followed by sm50 (0.46-fold) and SM30 (0.58-fold), suggesting that these genes were substantially repressed following inhibitor treatment.
Genes with Stable Expression (Fold Change ≈ 1)
Genes with fold-change values close to 1 exhibit little or no detectable change in expression between the experimental and control groups. In this dataset, synB (1.05-fold), pak3 (1.08-fold), and gcm (1.13-fold) remained close to the baseline, indicating relatively stable expression under the experimental conditions.
Overall, the results demonstrate that the inhibitor treatment produced gene-specific changes in expression rather than a uniform response across all developmental markers. While several genes were strongly induced or repressed, others remained largely unaffected, illustrating the selective nature of the treatment.